The Planet Behind the Numbers: Why Measuring Emissions Matters
Words by Ben Deyes
2 June 2026
Introduction
Creating an emissions inventory can demand a significant amount of time and resources, and it’s easy to become so absorbed in the process that we forget what the results actually represent. The outcome isn’t just numbers on a spreadsheet – there are real-world implications. We believe it is important to take a pause and remind ourselves how the earth’s climate has evolved and how we, humans, are effecting it.
What is global warming and climate change
Global warming is the long-term rise in the Earth’s average surface temperature, whereas climate change refers to the broader set of shifts this warming causes, such as altered weather patterns, sea level rise, biodiversity loss etc.
The Earth’s climate has historically swung between temperature extremes. Temperature records from weather stations only cover a tiny portion of the planets 4.54 billion year history. However, by examining indirect clues, such as chemical and structural signatures of rocks, ice cores, tree rings and ocean sediments to name a few, scientist can infer past temperatures (NOAA, 2025).
An evolving climate system
Changes in the Earth’s climate can be natural, driven by orbital changes, solar and volcanic activity. Between 600 and 800 million years ago, during the Neoproterozoic geological era, it is estimated that the earth underwent an ice age so cold, ice sheets extended all the way to the equator (NOAA, 2025). More recently, around 55.8 to 33.9 million years ago, during the Eocene Epoch, the Earth was approximately 13°C warmer than it is today (Henry and Vallis, 2022). So, we know the climate has changed considerably in the past, so what is different now?
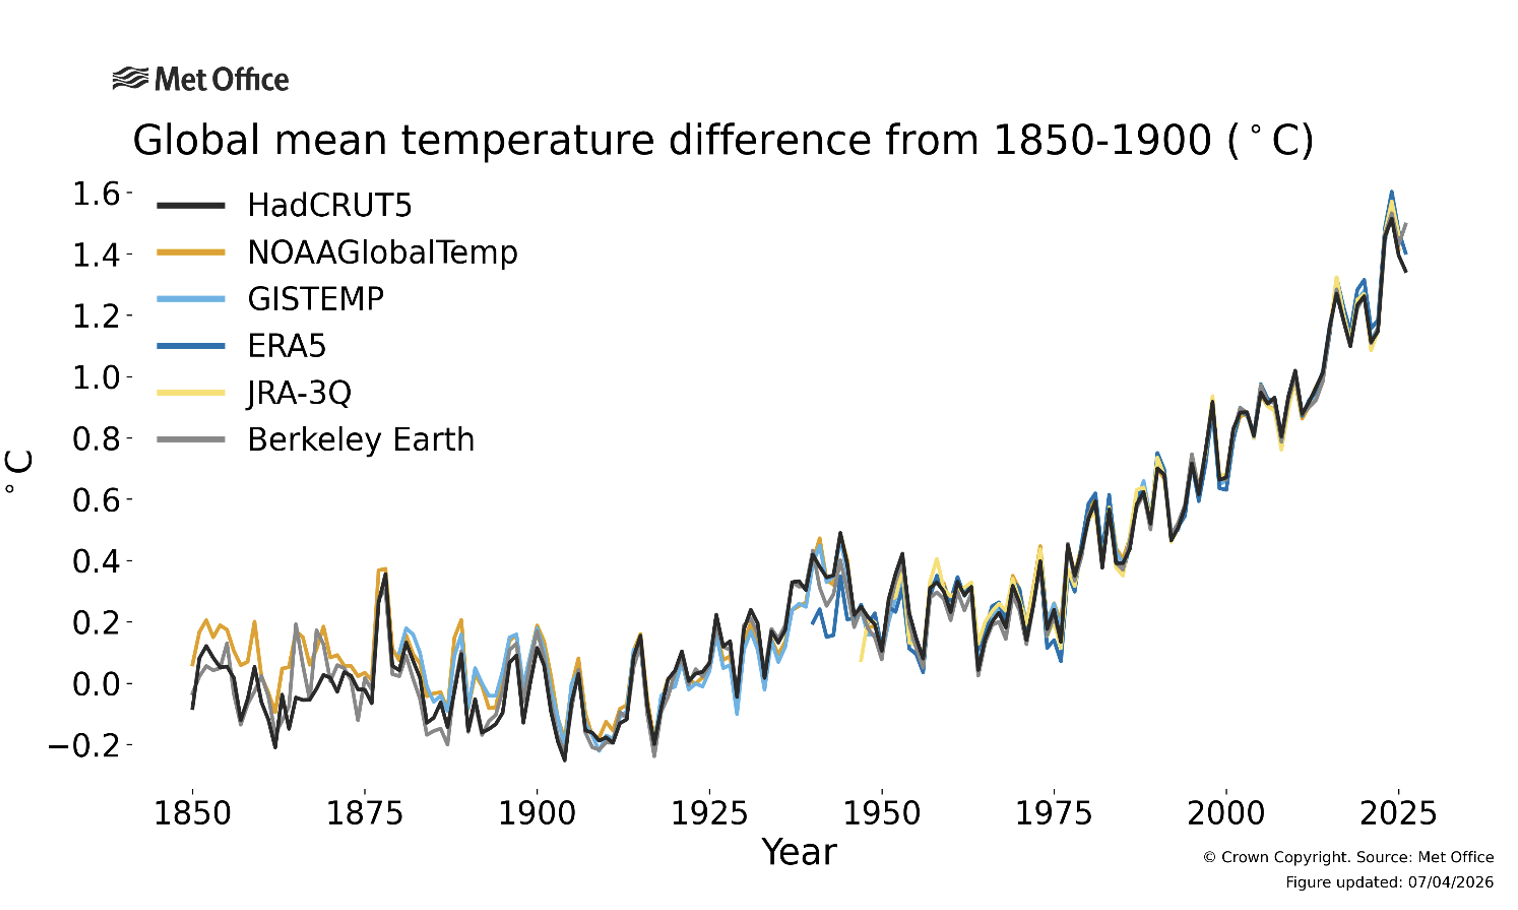
Since around the 1800s, human activities started influencing the climate (Carbon Brief, 2016). From around 1960, warming occurred at an unprecedented rate, faster than at any time in at least the last 2,000 years (United Nations, n.d.). Each of the last 4 decades have been successively warmer than any proceeding decade since 1850 (IPCC, 2021). Between 2011 and 2020, global surface temperatures were on average 1.1°C above the pre-industrial period (1850 – 1900) according to the IPCC (2023). The Intergovernmental Panel on Climate Change (IPCC), a global body of leading climate scientists, states that “it is unequivocal that human influence has warmed the atmosphere, ocean and land”.
There are many global average temperature datasets and graphs, but the one below is from the Met Office (2026), and combines a few different datasets. It shows the temperatures between 1850 and 2025 expressed as a difference from pre-industrial conditions (1850 – 1900). It is clear to see that the datasets broadly agree on the overall pattern of temperature change, with a clear and pronounced acceleration in warming from around 1960 onwards.
How are humans influencing the climate?
As World War 2 ended, the world entered a period of rapid economic, technological and social transformation, so profound that scientists refer to it as the Great Acceleration. Population boomed, industrial production surged, and global demand for energy soared. The demand was mostly met by burning fossil fuels such as coal, oil and natural gas. At the same time, land use, such as agriculture, and land use change, such as deforestation intensified. The combination of rapid growth and dependence on fossil fuels drove a steep upward curve in emissions that continues to shape the climate system today.
Emissions drive climate change
Greenhouse gas emissions, such as carbon dioxide and methane, absorb heat radiating from the earth and release it in all directions, including back down towards the Earth’s surface. This process effectively creates an insulating blanket around the planet. Greenhouse gases are critical for a habitable planet, as without them, the heat radiating from the earth would escape back into space and the Earth would have an average temperature of around -20°C (BGS, n.d.). However, the continuous loading of greenhouse gases into the atmosphere by humans, primally through the combustion of fossil fuels, is amplifying the greenhouse effect, causing temperatures to rise rapidly. The near-linear link between cumulative carbon dioxide emissions and global temperature rise is well established by the IPCC.
We often talk about carbon dioxide emissions more than other types of greenhouse gases, because this is the primary greenhouse gas emitted by human activities (NASA, 2023), but other gases also play a significant role in warming.
Impacts of climate change
The world is already experiencing widespread, rapid and intensifying changes due to climate change, leading to adverse impacts, losses and damage to people and nature. Some of the most significant effects include:
• More extreme weather: increased frequency and severity of extreme weather events, such as wildfires, droughts and flooding.
• Melting ice and rising seas: rapid loss of sea ice, glaciers and polar ice sheets is disrupting ocean currents and driving sea level rise.
• Ocean acidification: as the ocean absorbs carbon dioxide and heat from the atmosphere, waters become warmer and more acidic. This causes coral bleaching, habitat degradation, altered fish behaviour and cascading impacts across the entire marine food web.
• Biodiversity loss: changes to the climate and ecosystem are forcing species to migrate, adapt or face extinction. In 2024, WWF (2024) reported a 73% decline in the average size of global wildlife population in the last 50 years.
These impacts also trigger knock on effects: droughts exacerbate food and water insecurity and drive up food prices; wildfires and floods cause major economic disruption; prolonged heatwaves lead to health emergencies; and warmer temperatures allow diseases to spread more easily.
These are the impacts we are already witnessing today, but with every fraction of additional warming, the impacts intensify, become more frequent and harder to manage.
Future climate change
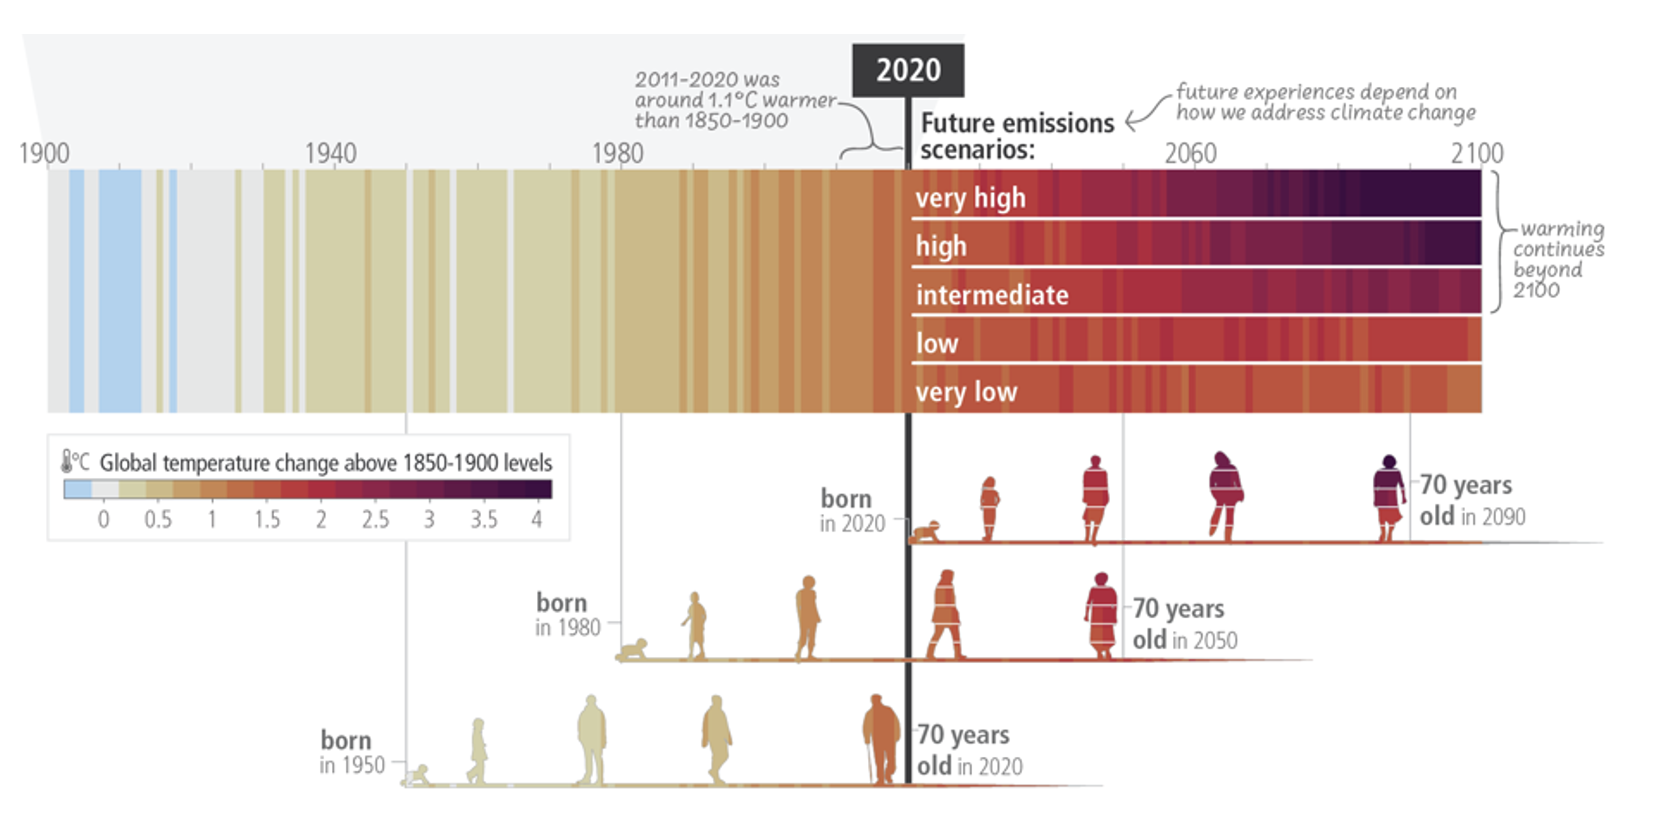
Future climate change is shaped by the choices we make now. The IPCC shows that future temperatures follow our emissions: if global emissions fall rapidly, warming stabilises but if emission continue to rise, warming intensifies. The figure below is taken from IPCC (2023) and demonstrates how different emissions scenarios impact global temperature change against the pre-industrial baseline.
Measurement enables action
To prevent further global warming and avoid worsening impacts of climate change, we must reduce emissions as much as possible, and balance out remaining emissions through carbon removal techniques. This principle reflects the broader goal of achieving net zero emissions – a state where the amount of greenhouse gas emitted is equal to the amount removed from the atmosphere.
As corporates control the majority of industrial, energy and agricultural activities, they are primary drivers of global emissions and therefore have a critical role in managing and reducing them. To do so, they must identify where their emissions are coming from, and which of their activities offer the biggest opportunities for reduction.
A complete and robust measurement of scope 1, 2 and 3 emissions is the foundational step in addressing climate change. Without this visibility, a company may unintentionally contribute more to global warming than it realises, overlook emission hotspots or miss opportunities to reduce its impact. With it, they can make informed decisions about operations, procurement and investments that drive down emissions and address climate change.
In many cases, actions that reduce emissions also make strong business sense. For example, rolling out an energy efficiency program reduces operational costs, installing an onsite solar PV system reduces reliance on highly volatile grid electricity prices, or engaging with suppliers to improve the efficiency of their products can help lower costs which can translate to lower prices for buyers.
Helping you manage your impact on the climate
Human activity is reshaping the climate, driving more severe weather events, damaging ecosystems, and effecting communities worldwide. To prevent these impacts from worsening, we must rapidly and deeply cut our emissions, and that begins with measuring them. Whether you are beginning your emissions reporting journey or strengthening existing processes, measuring emissions is a critical step in understanding and addressing climate change impacts, while also helping to identify opportunities to improve operational efficiency and reduce costs. We can support your organisation with practical, robust emissions measurement and sustainability solutions – reach out to us for a chat about how we can help you.
The link between measurement and net-zero
Under the Paris Agreement, nearly all nations agreed to limit global temperature increase to well below 2°C, and peruse effort to limit the increase to 1.5°C compared to pre-industrial levels (1850 to 1900). The target is based on research showing that exceeding the 1.5°C limit increases the risks associated with climate change compared with lower levels of warming, with 2°C resulting in significantly more severe impacts. To achieve this target, we must reach net-zero emissions by 2050 at the latest, which forms the basis of all science based net-zero emissions targets. Only by measuring emissions can we then calculate and plan our transition to net-zero.
Also, in case you are thinking we have already breached the 1.5°C limit in 2025, which we did, it does not mean that we have failed to achieve the Paris Agreements temperature goal, as this refers to long-term temperature increase, which is measured over decades, not a single year. This is to account for global warming from natural variations that may temporarily increase or decrease temperature in a given year.
References and further reading
British Geological Society (BGS). The greenhouse effect. Available at: The greenhouse effect – British Geological Survey
Carbon Brief, 2016. Scientists clarify starting point for human-caused climate change. Available at: Scientists clarify starting point for human-caused climate change
Henry, M. and Vallis, G.K., 2022. Variations on a pathway to an early Eocene climate. Paleoceanography and Paleoclimatology, 37(8), p.e2021PA004375.
IPCC, 2023. Climate Change 2023 Synthesis Report. Available at: AR6 Synthesis Report: Climate Change 2023 — IPCC
Met Office, 2026. Global temperature. Available at: Global temperature | Climate Dashboard
NASA, 2023. Major Greenhouse Gas Sources, Lifespan, and Possible Added Heat. Available at: ghg-lifespans-hs-3.png (8130×10175)
National Oceanic and Atmospheric Administration (NOAA), 2025. What’s the hottest Earth’s ever been? Available at: What’s the hottest Earth’s ever been? | NOAA Climate.gov
United Nations. What is Climate Change. Available at: What Is Climate Change? | United Nations
WWF, 2024. Catastrophic 73% decline in the average size of global wildlife populations in just 50 years reveals a ‘system in peril’. Available at: WWF LPR: Wildlife Populations Down 73% Since 1970 | World Wildlife Fund
Separate Info
Berkeley Earth, 2026. Global Temperature Report for 2025. Available at: Global Temperature Report for 2025 – Berkeley Earth
Addressing / Managing climate change starts with measurement
How can we help you and your organisation address / manage climate change
United Nations (a). 1.5°C, What is means and why It matters. Available at: 1.5°C: what it means and why it matters | United Nations
Related posts
Words by Ben Deyes
1 September 2026
Words by Ben Deyes
12 August 2026
Words by Kaylea Thomas
12 August 2026